Showing posts with label data. Show all posts

Tuesday, July 03, 2012

Automating online activities without IT intervention - using web tools to make jobs easier

There's often lots of small - and not so small - activities that communications teams want to carry out online that would make their jobs easier, but aren't really tasks to give to IT teams.

For example, you may wish to update your agency's Facebook and Twitter profile pictures when your logo changes, automatically post your blog posts to LinkedIn and Facebook, be sent an email whenever someone tweets at you or receive an alert whenever your Minister is mentioned in a breaking news story.

This is where it is useful to get familiar with services like IFTTT and Yahoo Pipes.

IFTTT, or "IF This Then That" is a simple logic engine that allow you to string together a trigger  and an action to create a 'recipe' using the format IF [trigger] then [action].

For example, below is a recipe used to automatically tweet new posts on this blog:
A recipe in IFTTT
A recipe in IFTTT

This sounds very simple, but it can be a very powerful labour saving tool. Each trigger and action can be from different online services, or even physical devices.
A recipe in IFTTT
A recipe in IFTTT (click to enlarge)
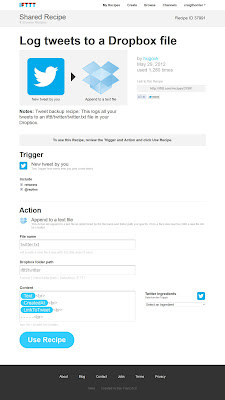
Recipes can be more complex, with various parameters and settings you can configure (for example the recipe above has been configured to append #gov2au to the tweets).

For example, at right is the full page for a recipe that archives your Tweets to a text file in your Dropbox.

Besides connecting the trigger (a new tweet from you) with the action (posting your tweet in Dropbox),  you can choose whether to include retweets and @replies.

You can set the file name where your tweets will be stored and the file path in Dropbox, plus you can set the content that is saved and how it will be formated.

In this case the recipe is set to keep the text of the tweet (the 'Text' in a blue box), followed on a new line by the date it was tweeted ('CreatedAt') and then, on another new line, a permanent link to the tweet ('LinkToTweet'), followed by a line break to separate it from following tweets.

You can add additional 'ingredients' such as Tweet name and User Name - essentially whatever information that Twitter shares for each tweet.

Rather than having to invent and test your own recipes, IFTTT allows people to share their recipes with others, meaning you can often find a useful recipe, rather than having to create one from scratch.

In fact I didn't create either of the recipes I've illustrated, they were already listed.

There's currently over 36,000 recipes to choose from, for the 47 services supported - from calendars, to RSS feeds, to email, to social networks, to blogs and video services, from SMS to physical devices.
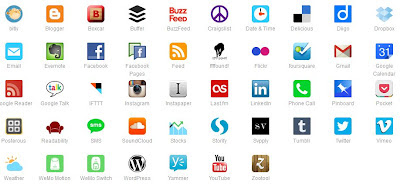
All the online services that can be 'triggers' for IFTTT
It is even possible to string together recipes in sequence.

For example, if I wanted to update my profile image in Facebook, Twitter, Blogger and LinkedIn, I can set up a series of recipes such as,
  • If [My Facebook profile picture updates] Then [Update my Twitter profile picture to match]
  • If [My Twitter profile picture updates] Then [Update my Blogger profile picture to match]
  • If [My Blogger profile picture updates] Then [Update my LinkedIn profile picture to match]
  • If [My LinkedIn profile picture updates] Then [Update my Facebook profile picture to match]
Using these four recipes, whenever I update one profile picture, they will all update.

Also it's easy to turn recipes on and off - meaning that you can stop them working when necessary (such as if you want to use different profile pictures).

However there's limits to an IF THEN system, which is where a tool like Yahoo Pipes gets interesting.

Yahoo Pipes is a service used to take inputs, such as an RSS or data feed, webpage, spreadsheet or data from a database, manipulate, filter and combine them with other data and then provide an output with no programming knowledge.

This sounds a bit vague, so here's a basic example - say you wanted to aggregate all news related to Victoria released by Australian Government agencies in media releases.

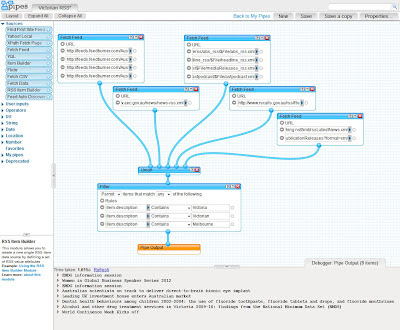
To do this in Yahoo Pipes you'd fetch RSS feeds from the agencies you were interested in, 'sploosh' them together as a single file, filter out any releases that don't mention 'Victoria', then output what is left as an RSS feed.
Building a Yahoo Pipe
Building a Yahoo Pipe (click to enlarge)
But that's getting ahead of ourselves a little... To the right is an image depicting how I did this with Yahoo Pipes.

Here's how it works...

First you'll need to go to pipes.yahoo.com and log in with a Yahoo account.

First I created a set of tools to fetch RSS from Australian Government agencies. These are the top five blue boxes. To create each I simply dragged the Fetch feed from the 'sources' section of the left-hand menu onto the main part of the screen and then pasted in each RSS feed URL into the text fields provided (drawing from the RSS list in Australia.gov.au).

Next, to combine these feeds, I used one of the 'operator' function from the left menu named Union. What this does is it allows you to combine separate functions into a single output file. To combine the Fetch feed RSS feeds all I needed to do was click on the bottom circle under each (their output circle) and drag the blue line to a top circle on the Union box (the input circle).

Then I created a Filter, also an 'operator' function and defined the three conditions I wanted to include in my final output - news items with 'Victoria', 'Victorian' or 'Melbourne'. All others get filtered out.  I linked the Filter's input circle to the Union's output circle, then linked the output from the Filter to the Pipe Output.

Then I tested the system worked by clicking on the blue header for each box and viewing their output in the Debugger window at bottom.

When satisfied it worked (and I did have to remove the filter condition 'Vic' as it picked up parts of words such as "service"), I saved my pipe using the top right save button, giving it the name 'Victoria RSS', then ran the pipe and published it at http://pipes.yahoo.com/pipes/pipe.info?_id=0392f5ec8f7450abbf650056c22f1e5d.


Note that pipes don't have to be published, you can keep them private. You can also publish their outputs as RSS feeds or as a web service (using JSON) for input into a different system. You can even get the results as a web badge for your site, by email, phone or as PHP for websites.
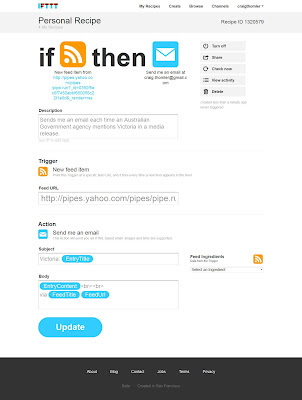
An IFTTT recipe built from the Yahoo Pipe above
(click to enlarge)
Alternatively you can even combine them with IFTTT - for example creating a recipe that sends you an email every time an Australian Government agency mentions Victoria in an media release.

In fact I created this recipe (in about 30 seconds) to demonstrate how easy it was. You can see it to the right, or go and access it at IFTTT at the recipe link: http://ifttt.com/recipes/43242

So that's how easy it now is to automate actions, or activities, online - with no IT skills, in a short time.

There's lots of simple, and complex, tasks that can be automated easily and quickly with a little creativity and imagination.

You can also go back and modify or turn your recipes and pipes on and off when needed, you can share them with others in your team or across agencies quickly and easily.

Have you a task you'd like to automate? 
  • Finding mentions of your Department on Twitter or Facebok
  • Tracking mentions of your program in the media releases of other agencies
  • Archiving all your Tweets and Facebook statuses
  • Receiving an SMS alert when the weather forecast is for rain (so you take your umbrella)
  • Posting your Facebook updates, Blog posts and media releases automatically on Twitter spread throughout the day (using Buffer)
The sky's the limit!

Read full post...

Friday, June 29, 2012

ACT Government planning to release a data portal and real-time bus information in reusable formats

Brought to my attention by @maxious, the ACT government has said in response to their Estimates process that they are building a data portal which they aim to have ready in July 2012.

Discussed in ACT's Hansard, Andrew Cappie-Wood, Head of Service and Director-General for ACT, said that, "There is a lot of interest in gaining access to data sets so that the community can use them more effectively.", giving the example of AllHomes' use of ACTPLA data.

Cappie-Wood went on to state that the ACT government intended to progressively make data sets available, keeping privacy issues front-of-mind, but pursuing a proactive approach so that the community could make their own apps through reusing the data and also use the data in other ways useful to the community.

Later in the Estimates session Paul Peters, Executive Director, Roads and Public Transport Division, said that there was also the intention to make real-time information on the location of ACTION buses available through data.gov.au such that various players in the market can develop and on-sell their own apps.

Read the transcript in ACT Government Hansard (PDF)

  • Data portal - refer to page 866
  • Real-time bus information - refer to page 919

Read full post...

Friday, June 22, 2012

Is this a world first? Australia's Bureau of Statistics #rickrolls its Twitter followers

Australia has been at the forefront of social media use by government agencies for a few years now (though don't tell them I said so or they might get complacent).

However I think this is possibly a world first.

The Australian Bureau of Statistics (ABS) yesterday released the first tranche of results from Australia's 2011 Census, to widespread interest - partially fuelled by their effective use of social media during the data collection process.

Today the ABS thanked Australians, via Twitter, for their support with the following message.

Thank you Australia for the great support for the Census. Please see here for a special gift from the 2011Census team

The thank you link went to a classic internet meme. The RickRoll.

As far as I know this is the first time any government agency, anywhere in the world has RickRolled it's citizens - although the Zombie Apocalypse has been featured several times, by the CDC and by Queensland Police.

I like governments with a sense of human - they feel more human, more connected and more relevant.

From the reaction on Twitter, others feel the same way.

In my view this is a brilliant step that cements the ABS's position as one of the most effective organisational users of Twitter.

They have successfully built and directed attention to the importance of statistics, supporting the census process, through their sensitive, factual and yet human use of the medium.


However I wonder if this show of humanity will be punished by those who wish to portray governments in a negative light, as monolithic, humourless, emotionless institutions.

If you make your money from criticising governments, you don't want them to seem too likeable or human.

Update
I've just been reminded on Twitter that the US government was actually the first to RickRoll its followers in July last year, as covered in this Washington Post article, Did the White House just rickroll its 2 million Twitter followers?

Still it leaves the ABS as an early adopter.

Read full post...

Thursday, June 21, 2012

It's Census (data) day!

Today at 11:30am the ABS releases the first tranche of the 2011 Census's data - including the core demographics.

How is this Gov 2.0 related? There's a number of ways.

First, this is the first time the majority of Census data will be released, from day one, under a Creative Commons license as open data for reuse. This means that statisticians and interested people (like myself) will be able to download and crunch a lot of the information to find out interesting stuff.

Second, this is the first time the Census release is being announced via social media - with the @2011Census account leading the way, and a number of people already Tweeting using the #2011Census hashtag.

Third, there's a lot of data in the Census that will inform Gov 2.0 efforts. Population demographics, media usage and other data is all useful in building business cases and uncovering opportunities to use new media more effectively.

Fourth, this is the first Census in Australia to have a significant proportion of the data collected online. While the ABS did use a pilot eCensus system for last Census, this time online was a primary collection network for household data.

Finally we're likely to see some very interesting apps, infographics and maps using Census data in ways that were never before possible. These will emerge from the ABS, from other agencies and from the community and commercial sector.

To give an idea of what might come out of this, below is an interesting pre-Census infographic created by McCrindle Research to show Australia's place in the world.

Australia at 23 Million: A mid-sized country but world beating growth infographic by McCrindle Research
McCrindle Research | Know the Times

Read full post...

Sunday, June 03, 2012

GovHack presentations and judging liveblog

Hi, I'll be liveblogging the presentations and judging from GovHack in Canberra below as it happens.

All the tears and all the cheers as 42 entrants go head for head for around $40,000 in prizes and the street cred of being a GovHack winner.

You can view all the entrants on the GovHack website.

Vote and comment on them now at govhack.dialogue-app.com (your views will be taken into account by the judges).


Photos from the GovHack presentations

GovHack crowd in Canberra

The big screen at GovHack

Watching the Sydney GovHack crowd


Read full post...

Monday, May 28, 2012

Modelling open data - new visualisation from recently released BOM data

The Bureau of Meteorology has released new data for reuse under Creative Commons licensing, ahead of the upcoming GovHack in Canberra next week, and Mark Hatcher has used it to model 153 years of Sydney weather in a short video (image to right).

The higher the temperatures, the warmer the colours.

This is a good example of how data can be reused by the public to provide different insights or perspectives into topics - providing evidence to inform different viewpoints.

These public mashups could then potentially be re-adopted (crowdsourced) and shared by governments, where they offer new insights, to better communicate with and engage the community or staff.

Of course there are technical smarts involved in this type of modelling, however tools such as ManyEyes, Visual.ly, Infogr.am and Piktochart make it easy for individuals with no technical training to create interesting views from raw data.

These tools can even be used by government agencies to model their own data - useful both for public engagement and internal engagement with staff or management. Though note it is important to only create infographics from publicly available data as the processing may be done in the cloud!

Mark's complete (41 second) video of his visualisation is below. If viewing it at work I suggest turning down the sound so as to not distract colleagues.


UPDATE:
I've received a clarification as to what data was new - and it's actually new functionality.  You can now download 'all years of data' in a single file, for daily rainfall, temp and solar exposure - hat tip to Jim Birch.

This improvement makes it much easier to produce mashups like Mark's above.

Read full post...

Tuesday, May 08, 2012

Participate in Melbourne Knowledge Week 2012

The City of Melbourne was recognised in 2012 as ‘Most Admired Knowledge City’ in an award from the World Capital Institute and Teleos, an independent management research firm.

The city is building on this with the annual Melbourne Knowledge Week, designed to engage both the knowledge community and the wider public in a range of events and opportunities that help promote Melbourne's identity as global knowledge city.

I reckon there has to be a place for Gov 2.0 in this mix and wanted to flag to all my Victorian readers that an expression of interest is now open to businesses, organisations, educational institutions, networking groups, community groups and individuals who wish to showcase knowledge-related projects, thinkers and capabilities as part of this year's event.

Melbourne Knowledge Week runs from 26 November to 1 December. More details on the event, and the expression of interest, are at http://www.melbourne.vic.gov.au/enterprisemelbourne/events/KnowledgeWeek/Pages/KnowledgeWeek.aspx

Read full post...

Monday, May 07, 2012

Share in over $30,000 worth of prizes by participating in GovHack 2012

With a strong focus on government data, GovHack is inviting teams of programmers and designers to invent new and better ways of delivering government data to Australians and will be rewarding the best apps, data mash-ups, and data visualisations with a share of $30,000 in prize money.

The event, being held in Canberra and Sydney from 1st - 3rd June, will challenge teams to answer the question and develop solutions for 'how can government data be better used to benefit Australians?'

The organisers have secured over thirty thousand dollars in prize money through sponsorships, although Pia Waugh, the chief organiser is tight-lipped about the prize categories, "We want people to come with fresh ideas and concepts and to build them at GovHack using publicly released data from government agencies. To keep the playing field level, we won’t tell anyone the prize categories until the event."

In previous years GovHack winners have found ways to compare government lobbying with the results of successful tenders, and designed mobile apps to help people find the nearest public toilet.

"This is a unique opportunity to be a part of generating ideas for how government can better use and re-use the wealth of information hidden away in its databases. By being a part of this event the participants get to, in a small way, directly influence how government data managers will look at and manage their data stores" Pia said.

GovHack is being supported by organisations including Adobe, MailChimp, Palantir and some of the biggest data holders in the Australian Government are providing prize money and data, including the National Archives of Australia, the Australian Government Information Management Office (AGIMO), and the Bureau of Meteorology.

GovHack is an official part of 2012 APS Innovation week, with the support of the Department of Industry, Innovation, Science, Research and Tertiary Education.

You can now register to participate, review the competition rules, or see an outline of the data to be made available on the GovHack site (http://www.govhack.org).

Prize categories will be announced at the event's opening on Friday 1st June.

Read full post...

Tuesday, April 24, 2012

Global Data Science Hackthon - Canberra Event - 28 April 2012

I have just been alerted of the event below, well worth attending for any public service and data types. And there are prizes!

Are You a Smart Data Scientist? Participate in this Hackful Event. 24 Hours of Non-Stop, Fun Data Science Competition.

The aim of the hackathon is to promote Data Science and show the world what is possible today combining Data Science with Open Source, Hadoop, Machine Learning, and Data Mining tools.

In addition, the event’s aim is also to promote the sense of community, team work, and free spirit competition for the sake of Data Science.

Who: Hackers, computer scientists, programmers, mathematicians, statisticians, econometricians, data miners, YOU!

What: Use your smarts to compete against teams from around the world and win the title of "Global Data Science Hackathon Winner 2012" as well as some great prizes!

When: The venue opens from 8.30 pm on Saturday 28 April, and the competition kicks off at 10pm Canberra time on Saturday 28 April. You then have 24 hours to hack the data and win! Throughout the competition, there will be a live leaderboard (the competition is hosted by kaggle.com)

Where: Register for the Canberra event http://meetup.com/DSCanberra/events/57837482/ (nb registration is required but free!)

Why: For fun - a chance to test your skills against the best and participate in a global event.

How: Register on the address above and get your laptop ready for some serious data science hacking!

We will provide the venue and internet access. You bring a laptop and your data science hacking smarts! During the competition, we will be running venue based mini-events, talks and competitions. And we will have a video-hookup with other venues around the world.

Read full post...

Friday, April 20, 2012

If Facebook, Twitter, LinkedIn, Google Plus and MySpace were Aussie states

Many of you are probably aware that Facebook's active membership is larger than the population of the world's third largest country, however the numbers are getting too big to relate to Australia.

So I've taken the idea and compiled a view of Australia by state, including the main social networks used by Aussies as if they were states.


Notes
  • Growth rates are based on 9 months, with state population for March 2012 extrapolated by applying 75% of the growth for the 2010/11 year from the ABS. The growth rates for social networks were calculated backwards based on having statistics on subscribers for both March 2012 and June 2011.
  • Google Plus wasn't on the scene until August with 365,000 users - since then it has grown at a rate of approximately 337% per year, making it by far the fastest growing social network.
  • Some social networks have decreased in numbers. Two data points are not enough to establish a trend and Twitter tends to fluctuate up and down on a monthly basis and it is difficult to define a clear direction for the service. MySpace's trend has generally been down for several years (refer to this Infograph and data for 2011 from Social Media News).

Sources:

Read full post...

Wednesday, April 18, 2012

ACBI Broadband Apps Day 2012 in Sydney

I've just been let know that the Australian Centre for Broadband Innovation (ACBI) is hosting a Broadband Apps Day at Australian Technology Park in Sydney on Friday 27 April.

As their summary about the event states, Apps - simple, useful applications that run on smart phones and tablets - are becoming increasingly popular, but where are the apps for next generation broadband in Australia?

Australian developers have produced many globally successful apps, such as Fruit Ninja and Flight Control. These have helped create an export market for many smaller companies such as Half Brick, Firemint and Traction Games.

  ACBI are holding this seminar to create a bridge between the technology sector, developers and the users of future broadband apps and, through this, help the public gain greater understanding of the potential value of broadband.

  What: ACBI Broadband Apps Day
When: 27 April 2012
Where: Australian Technology Park, Sydney.
Cost: Free

  Register online at: http://broadbandappsday.eventbrite.com.au

  ACBI is a partnership between CSIRO, the NSW Government, NICTA and NBN Co, and you can follow them on Twitter at: @Apps4Broadband

Read full post...

Saturday, March 31, 2012

Australia goes mobile - 47% of net connections via mobile devices

It's long been reported that the majority of internet connections in Japan are via mobile devices - since 2006 in fact.

It now seems Australia is on the verge of following the same path, with the ABS reporting that as at 31 December 2011, 47% of internet connections in Australia were via mobile devices.

The report, (8153.0 - Internet Activity, Australia, Dec 2011), has some other interesting findings as well...
  • The number of internet connections grew by 11.0% in the year to 31 December, and by 6.3% since the end of June 2011.
  • Mobile wireless grew fastest, with a 14.7% increase since the end of June 2011.
  • The number of dial-up connections continued to decline, to 475,000 - still a substantial number, but representing only 4% of the total 11,596,000 internet connections in Australia. Of those 379,000 (3.2%) were households, the rest businesses. 
  • The number of dial-up connections declined 17.9% (from 579,000 to 475,000) since June 2011.
    Note the ABS state the decline was 16.7% - I don't know why our calculated figures differ.
  • More Australians remain on connection speeds less than 8Mbps (55%), however a good proportion are on 8-24Mbps (34.3%). Only 0.3% are on connections greater than 100Mbps.
  • The total data downloaded was 345,518 Terabytes (or 345,518,000 Gigiabytes) for the three months ending 31 December 2011. This was an increase of 26% since June 2011 (remember the number of connections only grew by 6.3% so we're all downloading more). 
  • The average downloaded per connection was 29.8 Gigabytes (Gb) for the three months so, on average, we download 10Gb per month.
  • However dial-up users only downloaded, on average, 67 Megabytes (Mb) of data per month, while broadband users downloaded an average of 10.3 Gb of data - showing a massive difference in usage.
  • There were 91 ISPs in Australia with more than 1,000 subscribers - remaining a competitively very robust market.

There is a clear paradigm shift for users when upgrading to dial-up to broadband, with usage increasing by over 15,000%.

This representing a change from email and basic web browsing to the use of the internet as a multi-media interactive entertainment, engagement and service delivery environment.

It will be interesting to see the the paradigm shift in usage from users on fixed internet connections to mobile. I believe this is even greater as the services relevant to mobile users are very different to those relevant to static users.

Perhaps we can take another lead from Japan on this, based on the use of mobile internet during and following their recent tsumani.

Or learn from these five cities benefiting from mobile apps.

Read full post...

Monday, March 26, 2012

Is online influence measurable or meaningful?

Online influence is a hot topic right now, with companies such as Klout, PeerIndex, Empire Avenue and Kred all building online services that aim to measure the influence of internet users, in order to better target advertising dollars.

But how effective are these services really?

Does the number of followers, retweets or likes or some form of combination really identify those most likely to influence decisions and behaviours on a large scale?

Would any of these services have identified Janis Krums as an influencer of millions, before he tweeted a photo and message to his 170 Twitter followers about the plane that had landed on the Hudson River?

Would they have identified QLD Police Media as an important and influential account a few weeks before the Brisbane floods?

Would any of them have identified Rebecca Black, singer of 'Friday', as influencing an entire generation?

Influence online can ebb and flow rapidly. People go from virtually unknown to globally famous to unknown in a matter of weeks, days - even hours.

Therefore I was interested, but perplexed when I received the following email from PeerIndex a few days ago.

PeerIndex email:
I work at PeerIndex and we have a group on Australia top Twitter influencers and was wondering if I could get your feedback because you are on the list. PeerIndex measures interactions across the web to help people understand their impact in social media.

I was wondering if you could look over the list and let me know if you felt it was accurate? Do you recognise the other people on this list?  Is it missing people that you think are important?  

We would like to open up a dialogue with people in your field and think this would be useful to them (or at least start a conversation) it was accurate and interesting.

 
Thanks very much for your time,

I had a bit of a think about this and realised that I am an influence sceptic.

I am interested in sentiment online - whether people believe/perceive and say good or bad things about a topic. I think there's a strong future in this as a way to judge a general mood, supported by other more refined techniques.

However influence is just too hard to measure if only one dimension - online is taken into account.

Hence my reply, below:
Hi ,
 
I would love to help, however I don't think I honestly can.

I just do not understand how influence on Twitter, or on other online or offline social networks or situations, can be calculated in any effective manner.

Interactions online don't necessarily translate into actions offline and influence is generally a subtle and cumulative process - which requires multiple sources over a period of time.

For example, you tell me something on Twitter, I see something related from someone else in a forum, it gets discussed at work, I do some research as my interest is raised, then it appears in the traditional media and then I see others I trust taking a position and then I do.

The interlockings between topics and influence are incredibly complex and related to individual mental models and worldviews. Something that would influence one person will have no impact on another, people weight influence based on source, channel, frequency and relationship - and every individual has their own influence model - what will or will not change their view.

For an example (or study) of this, just watch the classic movie '12 angry men'. It is a brilliant look at how varied the influencers for different people may be.

I don't think there is a reliable way to identify influencers or put people in boxes for influence.

I find your, and other similar services, amusing, but do not see how your algorithms have accurately modeled my, or anyone else's levels of influence on the micro or metro topical level. 

Your models are simply far too simple and work on a subset of observable influences with no characterization of the individual influentiability of different people in different environments at different times - nor how long-term that influence will be.

Behavioural psychology is an extremely complex and poorly understood science. About the only way we can reliable detect influencers at any specific time or micro topic is in hindsight.

Humans are lousy at determining what is likely to be influential, other than by 'gut instinct', or through sledgehammer techniques, such as mass repetition (show the same message enough times to a broad enough group of people and some will be influenced).

So sorry, I don't know what makes people influential - chance, chemistry, repetition, a match with a particular mental model, a combination of influencers all working in alignment, or a reaction against a 'negative influencer' (a de-influencer? Someone we love to disagree with).

I certainly don't see how dividing people into boxes by arbitrary topic helps define their broader influence, or specific influence across other topics. The amount they talk about a topic isn't a good judge either, and it is always unclear whether someone 'heard' the message on a service such as Twitter.

So I don't think I can help you. Nor am I sure if your service, or Klout or the others in the space has a real business model. Though I do hope that your collective efforts expand our understanding of how connections between people can sometimes influence them.

Cheers,

Craig

What do you think?.


Read full post...

Monday, March 19, 2012

From open data to useful data

At BarCamp Canberra on Saturday I led a discussion asking how we can help governments take the step from open data (releasing raw datasets - not always in an easily reusable format) towards usable and useful data (releasing raw datasets in easily reusable formats plus tools that can be used to visualise it).

To frame this discussion I like to think of open data as a form of online community, one that largely involves numbers rather than words.

Organisations that establish a word-based community using a forum, blog, wiki, facebook page or similar online channel but fail to provide context as to how and why people should engage, or feed and participate in the discussion, are likely to get either receive little engagement or have their engagement spin out of control.

Equally I believe that raw data released without context  as to how and why people should engage and no data visualisation tools to aid participation in a data discussion are likely to experience the same fate.

With no context and no leadership from the data providers, others will fill the informational gap - sometimes maliciously. Also there's less opportunities for the data providers to use the data to tell good stories - how crime has decreased, how vaccination reduces fatalities, how the government's expenditure on social services is delivering good outcomes.

Certainly there will always be some people with the technical experience and commitment to take raw open data, transform it into a usable form and then build a visualisation or mash-up around it to tell a story.

However these people represent a tiny minority in the community. They need a combination of skill, interest and time. I estimate they make up less than 5% of society, possibly well under 1%.

To attract the interest and involvement of others, the barriers to participation must be extremely low, the lesson taught by Facebook and Twitter, and the ability to get a useful outcome with minimal personal effort must be very high, the lesson taught by Google.

The discussion on the weekend seemed to crystalise into two groups. One that felt that governments needed to do more to 'raise the bar' on the data they released - expending additional effort to ensure it was more usable and useful for the public.

The other view was that governments have fulfilled their transparency and accountability goals by releasing data to the community. That further working on the data redirects government funds from vital services and activities and that there is little or no evidence of value in doing further work on open data (beyond releasing it in whatever form the government holds it).

I think there's some truth in both views - however also some major perceptual holes.

I don't think it necessarily needs to be government expending the additional effort. With appropriate philanthropical funding a not-for-profit organisation could help bridge the gap between open and usable data, taking what the government releases and reprocessing it into outputs that tell stories.

However I also don't accept the view that there was no evidence to suggest that there was value in doing further work on open data to make datasets more usable.

In fact it could be that doing this work adds immense value in certain cases. Without sufficient research and evidence to deny this, this is an opinion not a fact - although the evidence I've seen from the ABS through the census program (here's my personal infographic by the way), suggests that they achieved enormous awareness and increased understanding by doing more than releasing tables of numbers - using visualisations to make the numbers come alive.

Indeed there is also other evidence of the value of taking raw data and doing more work to it is worthwhile in a number of situations. Train and bus timetables are an example. Why does government not simply release these as raw data and have commercial entities produce the timetables at a profit? Clearly there must be sufficient value in their production to justify governments producing slick and visual timetables and route maps.

Some may argue that this is service delivery, not open data (as someone did in the discussion). I personally cannot see the difference. Whenever government chooses to add value to data it is doing so to deliver some form of service - whatever the data happens to be.

Is there greater service delivery utility in producing timetables (where commercial entities would step in if government did not) or in providing a visual guide to government budgets (where commercial interests would not step in)?

Either way the goal is to make the data more useful and usable to people. If anything the government should focus its funds on data where commercial interests are not prepared to do the job.


However this is still talking around the nub of the matter - open data is not helping many people because openness doesn't mean usefulness or usable.

I believe we need either a government agency or a not-for-profit organisation to short circuit the debate and provide evidence of how data can be meaningful with context and visualisations.

Now, who would like to help me put together a not-for-profit to do this?

Read full post...

Wednesday, March 07, 2012

The elephant in the room

In case you've not read it yet, Steve Davies wrote an interesting piece on the government's grapple to adapt to and adopt Gov 2.0 thinking and practice. Published in the Canberra Times and Brisbane Times, the piece highlights that the elephant in the room is the culture of the APS, which is not always supportive of new ways of thinking and doing. It is worth a read. The article is titled The paranoia that will shut government.

Read full post...

Wednesday, January 18, 2012

Social media drives five times as much traffic to Australian government sites as online news media

A couple of years ago Hitwise, an internet measurement company that uses ISP logs to measure traffic to websites, reported that social media sites had become a larger source of traffic for Australian government websites than online news sites.

This was a seismic change in user behaviour. Suddenly people were more likely to reach a goverment site in Australia from Facebook, Twitter or another social media site than from news.com.au, smh.com.au, abc.net.au or another traditional news source.


Of course it may have also been a simple one month hiccup.

Therefore last week I asked Hitwise to provide a 'two years on' view at their blog to see if there was a trend.

And there was!

Social media referrals to government sites in Australia hadn't only remained above news and media sites, they'd skyrocketed.
Source: Hitwise Experian
As Tim Lovitt posted in Hitwise's blog, in a rather understated manner, Social Media important to Government, between December 2008 and December 2011 social media had doubled it's share while news and media had barely held it's own.

In fact, by December 2011 social media was sending 9.75% of the traffic to government sites while news and media sites were only sending 2.27% of the traffic.

So should agencies invest in producing more media releases or in developing their social media presence?

I know which I would choose.

Read full post...

Tuesday, January 10, 2012

Why aren't Aussies using open government data to create value?

This post was inspired by a comment by John Sheridan on Twitter,
craigthomler what I'd like for  ? egs of use of  for service delivery innovation, value creation etc, not just curiosity
It's a good New Years wish and highlights two questions that I have been pondering for a long time.

1. Why aren't people making more use of publicly release government data?
2. Does making government data publicly available have any value if people aren't using it to value add?

Let's take them in order...

1. Why aren't people making more use of publicly release government data?
In Australia the data.gov.au catalogue contains 844 datasets (and growing). NSW (data.nsw.gov.au) and Victoria's (data.vic.gov.au) catalogues are also quite large. 

By comparison, the US data.gov catalogue contains over 390,000 datasets, Canada's data.gc.ca over 265,000, the UK's data.gov.uk around 7,700,  Singapore's data.gov.sg about 5,000 datasets and New Zealand's data.govt.nz over 1,600 datasets.

Across these six countries (I am excluding the two states), that is in excess of 670,000 datasets released publicly. However if you search around there's not that many apps listed using the data. The US site lists around 1,150 and Australia's site lists 16 - however that's not many compared to the number of datasets.

As Victoria's data blog asks, what has happened to all the apps produced in government-sponsored competitions? Are they actually worth holding?

OK, let's work through a few possibilities. 

Firstly it could be that these datasets are being widely used, but people simply aren't telling the catalogues. Data may be embedded in websites and apps without any communication back to the central catalogue, or it may be downloaded and used in internal spreadsheets and intranets. In this case there's no actual issue, just a perceived one due to lack of evidence.

Secondly, to face facts, the majority of people probably are still not aware of these data catalogues - they haven't really been widely promoted and aren't of much interest to the popular media. Therefore there may be hundreds of thousands of people wishing to access certain government information but unaware that it is readily available.

Thirdly, those people aware of these datasets may be daunted by the number released, unable to find the data they specifically want to use or simply aren't interested.

Finally, perhaps simply releasing a dataset isn't enough. Few people are data experts or know what to do with a list of values. Could it be that we need simple and free analysis tools as well as raw data?


There's steps governments can take to address all of these possibilities.

If people aren't telling the government about their apps, why not establish light 'registration' processes to use them which capture information on why they are being used? Or if this is too invasive, offer people appropriate incentives to tell the central catalogue about their uses of the data.

Secondly, there may be a need to promote these data catalogues more actively - to build awareness via appropriate promotion.

Thirdly, perhaps we need to do more user-testing of our data catalogues to better understand if they meet the audience's needs. Combined with excellent mechanisms for suggesting and rating datasets, this could greatly inform the future development and success of these catalogues.

And finally, governments need to consider the next step. Provide the raw data, but also provide sites and tools that can analyse them. Sure governments are hoping that the public will create these, and maybe they will, however that doesn't mean that agencies can't do so as well. There's also pre-existing tools, such as Yahoo Pipes, IBM's Manyeyes and analytics tools from Google which could be pre-populated with the government datasets, ready for users to play with.

Alongside all these specific solutions, maybe governments need to start using some of the tools at their disposal to ask why people aren't using their data. Is it the wrong data? Presented in the wrong way? Too hard to use? Market research might help answer these questions.

2. Does making government data publicly available have any value if people aren't using it to value add?

Now to take the second question - does it really matter whether people are using open government data anyway?

Are there other goals that releasing data addresses, such as transparency and accountability, intra-government sharing and culture change?

If the mandate to release data leads to government culture change it may drive other benefits - improved collaboration, improved policy outcomes, cost-savings through code and knowledge sharing.

Of course it is harder to provide a direct quantitative link between releasing data, changing culture and the benefits above. However maybe this is what we need to learn how to measure, rather than simply the direct correlation between 844 datasets released, 16 apps created.

Read full post...

Wednesday, December 21, 2011

50 million reasons to engage in Gov 2.0 co-creation and collaboration

Rose Holley is one of my heroes.

As a Digital Librarian at the National Library of Australia she has led one of the most effective, long-lived and under-rated Government 2.0 initiatives in Australia for the last four years.

As one of those responsible for the digitalization of Australia's newspaper archives (so far over 50 million articles), the online system she helped create has now seen 50 million lines of newspapers corrected by the public. That's over one million lines per month and a crowd sourcing effort proportionate for Australia (over the timeframe) as Wikipedia is for the world.

This project has run on a shoestring, with little promotion and no advertising. It works because it empowers people to contribute to the public good while also satisfying their personal needs. It trusts people to do the right thing, via a supportive context and light governance.

Sure these are just corrections of digitalized newspapers - where the automated digitalization process has failed to accurately read and transcribe letters and words. However it is also a collective record of Australian history, of families, of culture and of our development as a nation.

Given that the National Library's efforts have seen over 10,000 people per day updating newspaper records, with the most prolific person having corrected over one million lines - only two percent of the total - and negligible incidents of malicious sabotage - this is crowd sourcing at its best, right here in Australia.

The process used could be replicated for other archives of Australian public records - the National Archives, Parliament and every agency with a stock of paper files that have been approved for public release, but are too expensive for governments to transcribe.

Perhaps we need a central set of tools that agencies can use, perhaps a central site where agencies can load their scanned public documents. Either way, this is an opportunity begging to be exploited, a chance to do good for the country at little cost to government.

I hope it will not be ignored.

Read full post...

Tuesday, December 06, 2011

Why open data and public collaboration is important for 21st Century democracy

Beth Noveck, formerly the White House Deputy CTO, has published a fantastic paper on why it is so important to evolve democratic systems for the 21st century, and providing details of how a range of governments around the world are doing so.

The paper is titled "Evolving democracy for the 21st Century" and is available from her blog.

Through a combination of improved transparency and accountability, the public release of data in reusable formats and the willingness to openly collaborate with individuals, not-for-profits and companies in using that data and thinking from outside public services to develop new policy insights, governments today have the most significant opportunity in over a hundred years to reframe their relationships with their constituents and draw on the wisdom of the crowd to improve policy outcomes and services.

 I hope the opportunity is not squandered.

Read full post...

Monday, November 21, 2011

Brisbane City Council launches open data datastore

Brisbane City Council has released an open data public sector information datastore, allowing the community to access and reuse a range of council data under Creative Commons licensing.

While not the first council in Australia to do this (with Mosman City Council leading the pack), Brisbane is the first large metropolitan council in Australia to do so to my knowledge, joining a range of cities across North America and Europe.

Brisbane has launched the datastore with the Hack:Brisbane competition and is hosting an upcoming Hackfest next Saturday to stimulate usage of their information.

Hopefully other major cities across Australia will look at what Brisbane is doing and consider its value in their own jurisdictions.

Read full post...

Bookmark and Share